Dashboards
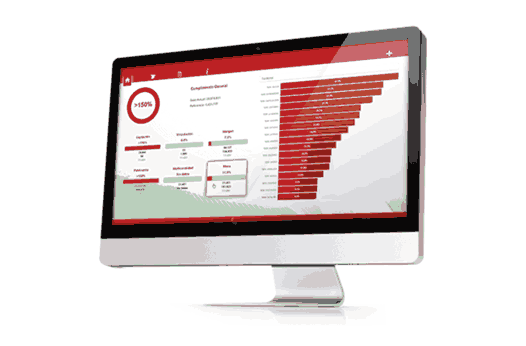
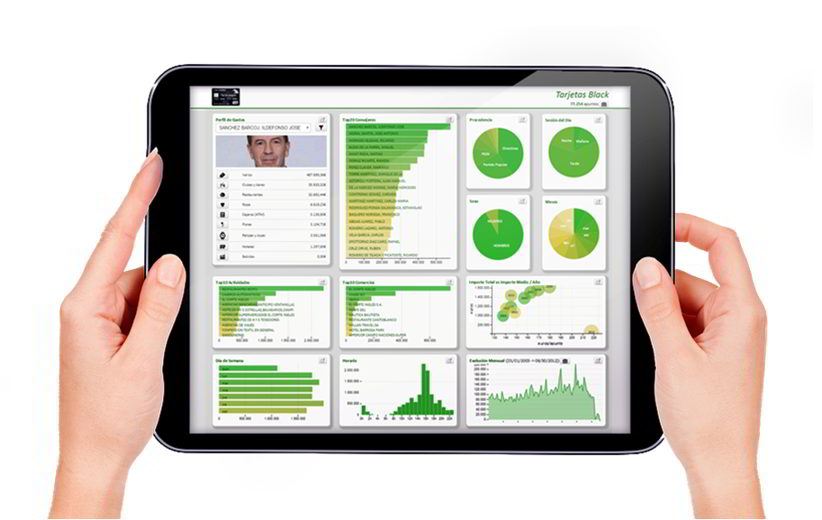
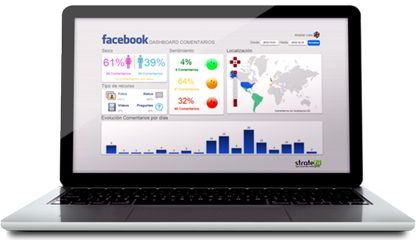
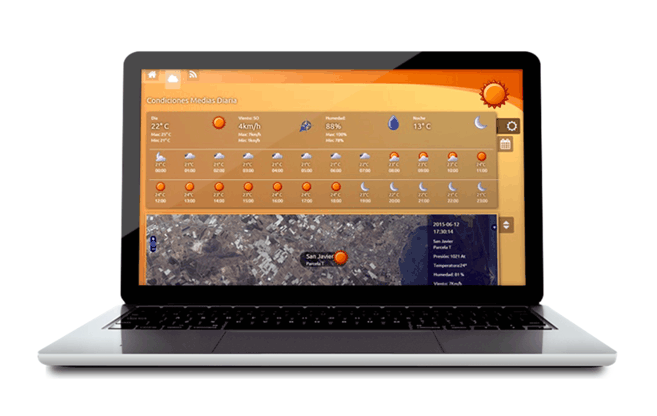
Dashboards are a simplified representation of a set of indicators that give us an idea of how it is behaving an area or process of our company. We allow a flexible and intuitive visualization of data, using such graphics, time line. scorecards maps, alerts, ...
The result of the experience of several years in developments for large corporations, our Dashboards have become an indispensable tool for managers and organizations responsible for day to day running of the organization. They are the competitive weapon most powerful to follow the progress of the company and the market and react quickly and effectively.
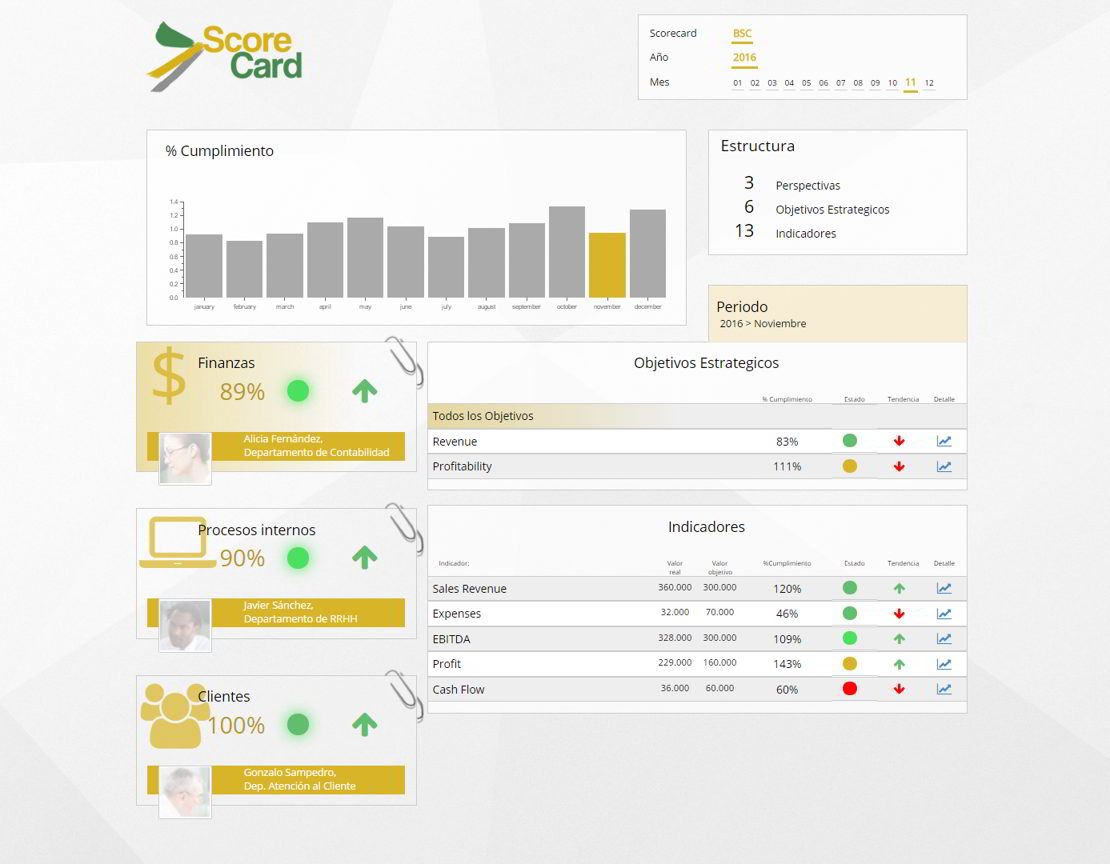
In addition, by identifying KPI's (Key Performance Indicators) corporate Scorecars were implemented, following the methodology of Norton and Kaplan.
> Portfolio Methodology Technical Features Maps Responsive Scorecard CM Advanced
Development methodology
-
Analysis and Decision Requirements
In this phase the indicators to be analyzed and graphic element with which the indicator is displayed is selected are collected.
-
Creation of Mockup
We create a sketch of what we want to be the end result, so it is a good idea to spend time and be thorough in their development.
-
Layout and Design
We implemented in HTML and CSS mockup created in the previous phase with static data and Responsive design.
-
Development Functionality
At this stage we develop all the functionality of the dashboard, creating database queries, the selected components in the analysis phase and develop the interaction between components.
Technical Features
For the development of dashboards the CTools are used. Ctools are a set of tools and components for Pentaho, which allows us to create advanced dashboards.
Community DASHBOARD EDITOR (CDE)
It enables the development and deployment of Advanced Dashboards on Pentaho. Its origin was to simplify the CTools when creating and editing dashboards it is a very powerful and complete tool, combined with a set of panels for creating data sources, selection of custom components, and HTML editing and CSS.
Community DASHBOARD FRAMEWORK (CDF)
CDF is the Open Source framework for creating highly customizable pictures on the front end Pentaho Business Intelligence server. CDF is based on web development standards such as CSS, HTML5, jQuery, Bootstratp, etc. Aimed at developers, CDF is an effective way to combine the data with a layer of attractive display solution.
Community CHART COMPONENTS (CCC)
CCC is the framwework of Open Source graphics library, which is included within the CTools. The goal of CCC is to provide developers a way to include in their dashboards types of advanced graphics. CCE graphics are very colorful, flexible and allow interaction with them, without losing the most attractive feature, its highly customizable by the Extension Points.
Maps: Allow you to perform a visual analytics to quickly identify a "where" and "why".
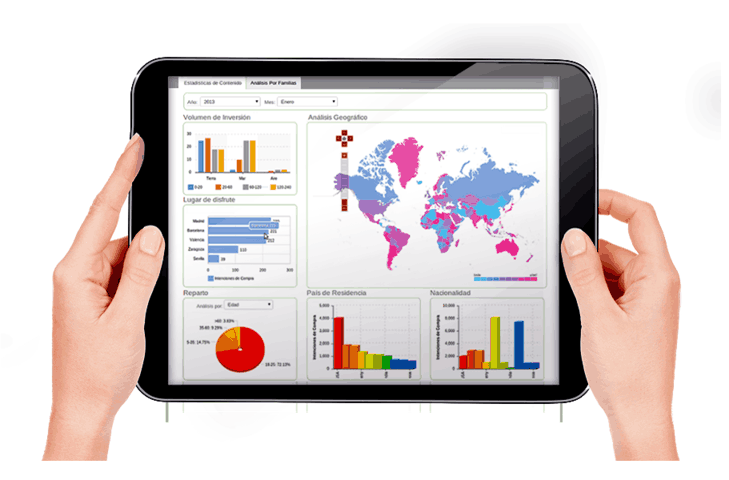
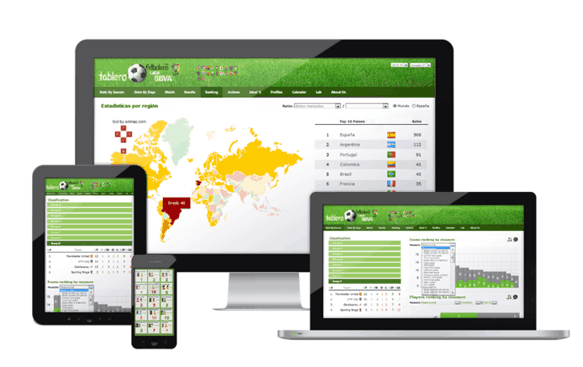
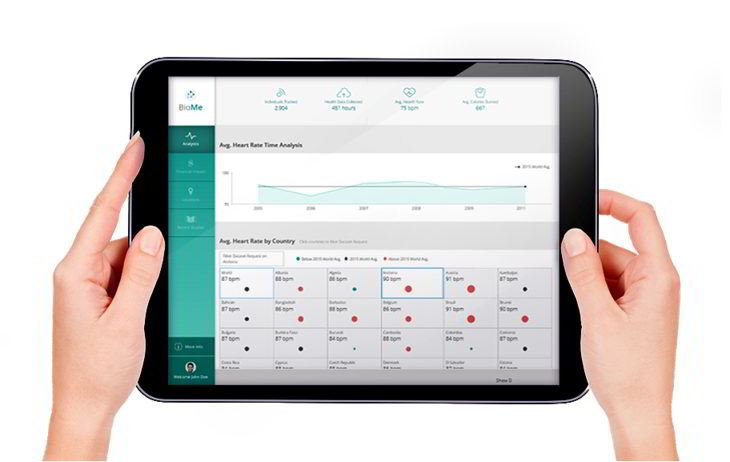
Responsive: All of our designs are accessible from anywhere on any device.
Scorecard: Robust Scorecard allow us to track the objetives identified in their KPIs (Key Business Indicators)
Advanced dashboards: we use the latest technologies in web development, such as HTML5, CSS 3, Bootstratp, JQuery, Font Awesome, Glyphicons, Numeral.js, BluePrint, DS.js, AmCharts, D3.js, Angulas.js, Node. js, Meteor.js, ...