


Access our whole DEMO BI
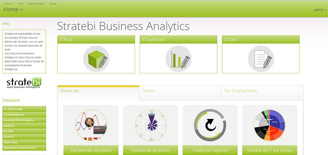
Check the potential of our solutions
In Stratebi we have created a large number of Online Demos, so you can see some examples made for several sectors, with public data. Discover in a practical way the amount of possibilities offered by our solutions and developments.
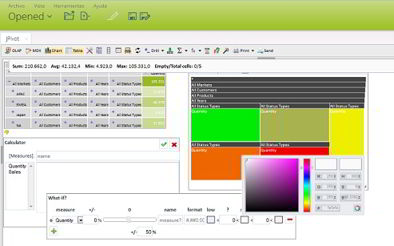
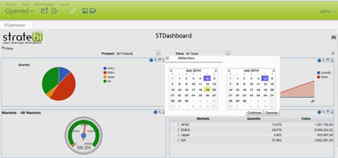
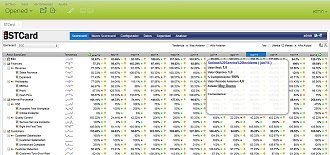
In the demo, you can evaluate LinceBI (STPivot, STDashboard or STCard), which are a set of tools developed by Stratebi and that give great power to our solutions.
Ask for Login Access Log in BI Demo
Other Online Demos…
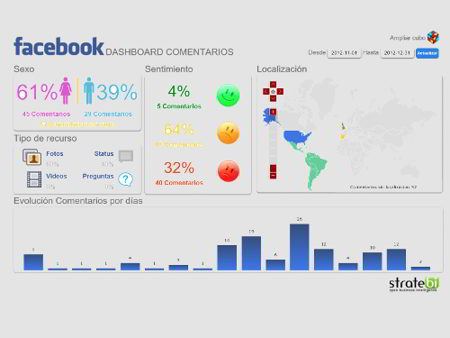
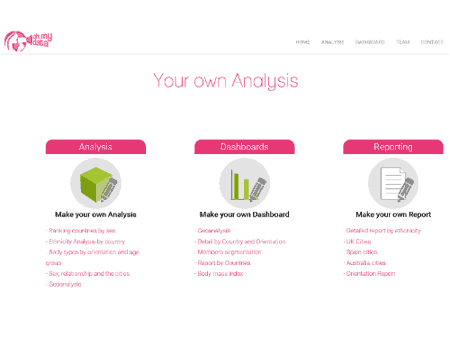
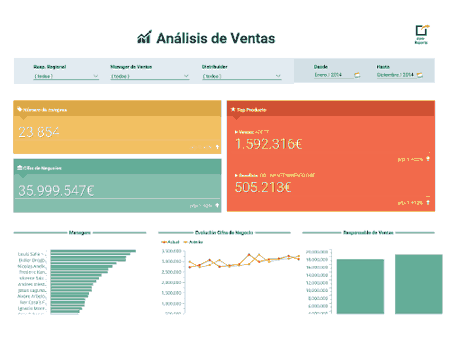
In order to show the variety of applications that can have an analytical system, we have developed a series of demos where you can evaluate different applications, KPIs examples and a variety of interfaces to display information. You'll be surprised!!
-
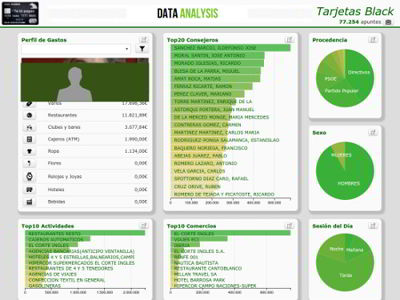
Análisis de Seguros
Nuestras solución para Seguros para el área de automóvil: se puede hacer un seguimiento de las Ventas de Pólizas, tasas de siniestralidad por tipos, primas, perfiles de clientes, etc…. Con las aplicaciones de Seguros que hemos desarrollado se obtiene un control 360º de la actividad aseguradora de la compañía, no solo en automóvil, sino en vida, hogar, etc…
-
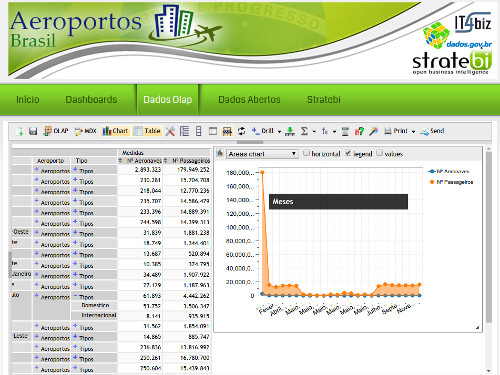
Aeropuertos de Brasil
Aplicativo que muestra los movimientos de aviones y pasajeros en los aeropuertos de Brasil administrados por Infraero.
En este ejemplo se dejan disponibles diferentes elementos de análisis como cuadros de mando y vistas OLAP demostrando la utilidad y posibilidades de las soluciones verticales desarrolladas para necesidades específicas.
-
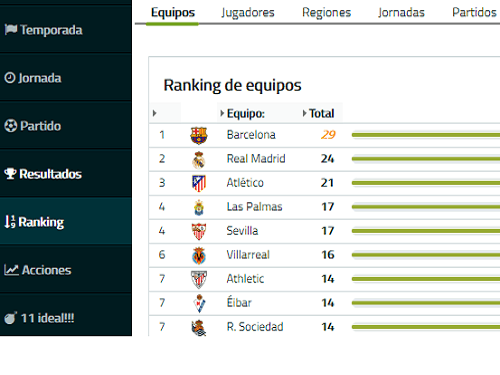
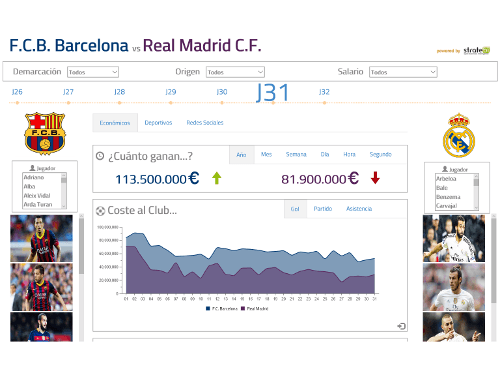
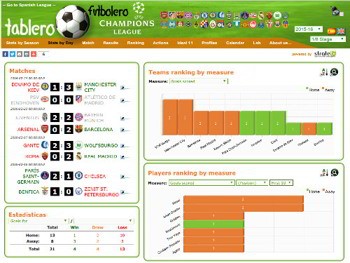
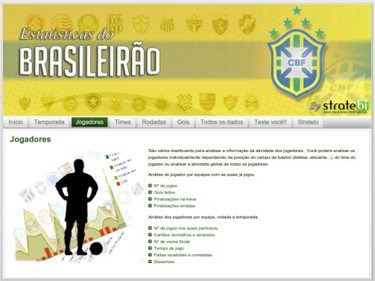
Futebol Brasileiro
Website que muestra los datos de la liga de futbol de Brasil. Por ahora solo tenemos los datos de los años 2010, 2011 y las jornadas que han sido jugadas en el 2012.
En este site podrás hacer un analisis minuciosa de los datos del "Brasileirão", campeonato por excelencia de Brasil, incluyendo los equipos, jugadores, goles... todo de forma simple y práctica.