Before organising a course or seminar, we listen to the real needs and objectives of each client, in order to adapt the training and get the most out of it. We tailor each course to your needs.
We are also specialists in 'in company' trainings adapted to the needs of each organisation, where the benefit for several attendees from the same company is much greater. If this is your case, contact us.
Ponemos a disposición también plataforma Cloud con todas las herramientas instaladas y configuradas, listas para la formación, incluyendo ejercicios, bases de datos, etc... para no perder tiempo en la preparación y configuración inicial. ¡Sólo preocuparos de aprender!
Ofrecemos también la posibilidad de realizar formaciones en base a ‘Casos de Uso’
Se complementa la formación tradicional de un temario/horas/profesor con la realización de casos prácticos en las semanas posteriores al curso en base a datos reales de la propia organización, de forma que se puedan ir poniendo en producción proyectos iniciales con nuestro soporte, apoyo al desarrollo y revisión con los alumnos y equipos, etc…
En los 10 últimos años, ¡hemos formado a más de 250 organizaciones y 3.000 alumnos!
Ah, y regalamos nuestras famosas camisetas de Data Ninjas a todos los asistentes. No te quedes si las tuyas
ETLs WITH TALEND
ETLs WITH TALEND
Goal
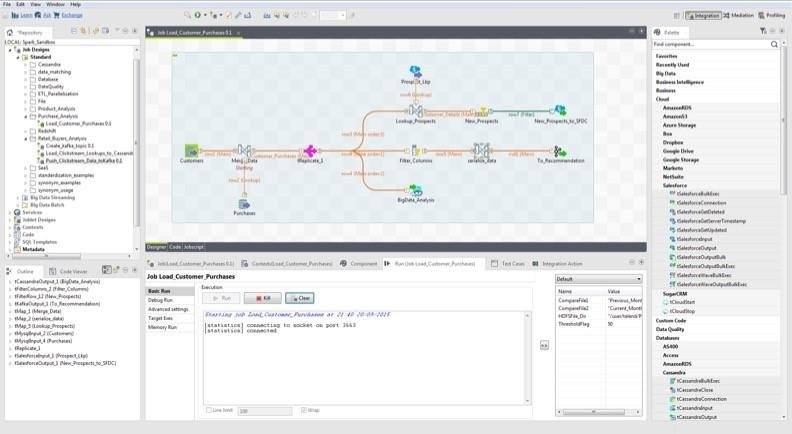
Talend is the European leader in data integration (ETL), Data Quality and Master Data Management.
It is backed by the creators and founders of Business Objects.
We are one of the first specialists in Talend in Spain.
Tibco did migration to Talend for Yell. We provide practical training, which lays the foundation of the Business Intelligence strategy, accompanied by participatory sessions, on real cases and business solutions.
Target audiences
Observations
Certification
All students receiving the course will be given a certificate of attendance.
Syllabus
1. Introduction
- Environments operations and integration with Business Intelligence
- Initial presentation of Talend Open Studio
2. Modeling jobs
- Using the Business Modeler
- Document management for the project
3. Using Job Designer to generate code
- Examples and exercises work designs
- Testing data sets
4. Components input / output
- Management access to XML files, delimited characters, etc ...
- Access Relational Databases
5. Metadata Repository
- Centralize connections
- Centralizing data flows and schemes
6. Data Transformations
- Using different components transformations
- Parameterization and mapping data using TMAP (join)
- Profiling data using filters
- Generation of different outputs and exception handling
- Practical exercises
7. Development Features
- Defining project environments (development, production)
- Inclusion of java code on jobs
- Set error handling
- Get statistics and logs of work
8. Debug and Deploy jobs
- Generation of technical documentation of work
- Using the Debug view
- Generate jobs and provide them as Web services
Machine Learning
Machine Learning
Goal
This course will understand the concepts needed to perform processes Machine Learning, this branch of artificial intelligence that aims to develop techniques that allow computers to learn.
Machine Learning projects create algorithms that can generalize and recognize behavior patterns from information provided by way of example ( training). Machine Learning techniques are used among others in the following areas: Medicine, Bioinformatics, Marketing, Natural Language Processing, Image Processing, Machine Vision, Spam Detection.

Target audiences
- ICT professionals: Consultants BI, Scientific Data.
- Professionals of Applied Sciences: Mathematics, Statistics, Physics.
Observations
- Methodology: The course intersperses theoretical parts where fundamental concepts are taught to understand the practical exercises taught.
- Requirements: Basics: Linear Algebra, calculus and probability theory.
Syllabus
Machine Learning with Scikit-Learn Data Science framework (Anaconda with Python 3)
1. Introduction to Machine Learning
- Techniques
- Classification
- Regression
- Clustering
- Preprocessing and dimensional reduction
- Attribute selection
- Performance evaluation
- Matrices de confusión
- KPIs R2, MAE, MSE
2. Regression (Prediction of continuous values)
- Algorithms
- Ordinal Least Squares
- Ridge Regression
- Laso Regression
- Elastic Net
- Examples
3. Classification (Identification of the category to which an object belongs)
- Algorithms
- Logistic Regression
- Support Vector Machines
- KNearest Neighbors
- Decision Trees
- Random Forest
- Multi-layer Perceptron
- Examples
4. Clustering (Grouping similar objects in sets)
- Algorithms
- KMeans
- Spectral Clustering
- DBSCAN
- Examples
Curso de PowerBi Avanzado
Curso de PowerBi Avanzado
Goal
¡Aprende con los mejores, Stratebi es Partner Oficial de Microsoft Power BI en España!
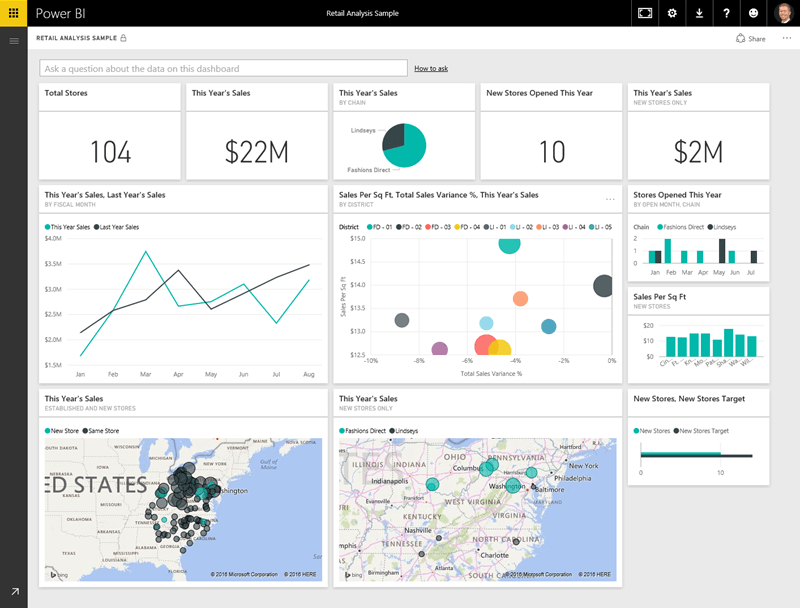
Power BI es un conjunto de aplicaciones de análisis de negocios que permite analizar datos y compartir información. ¡Es la solución perfecta destinada a la inteligencia empresarial!
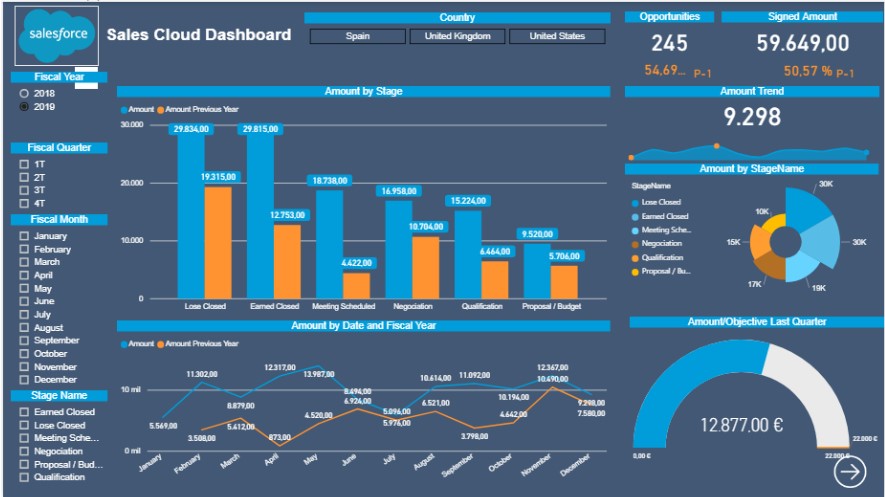
Conoce casos de uso y ejemplos de lo que podrás hacer.
Con Power BI podrás crear potentes informes utilizando diferentes fuentes de datos: SAP HANA, MySQL, Teradata, IBM DB2, Dynamics Navision, CRM, SQL. Archivos de Excel, .CSV, JASON o descargar datos procedentes de servicios en línea como Facebook, Google Analytics, CRM de Salesforce, Marketo, MailChimp...
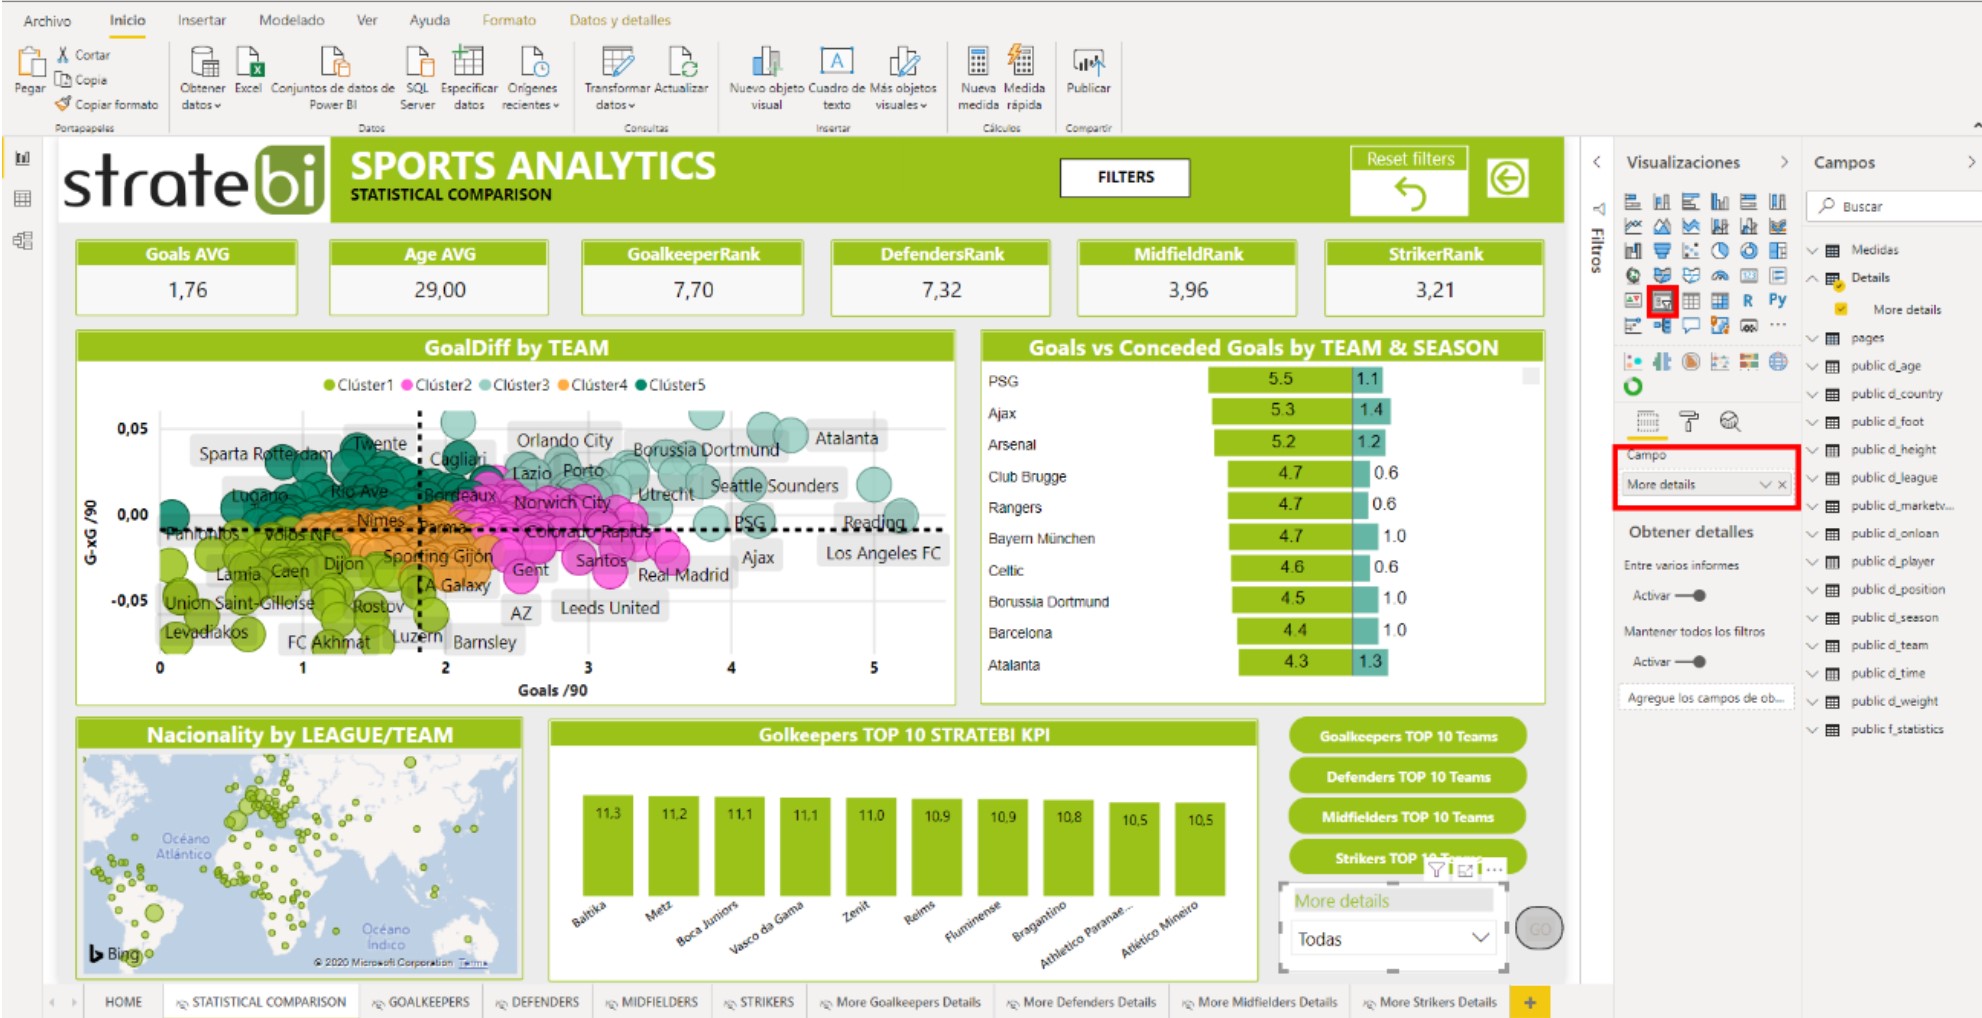
Stratebi es Partner de Microsoft PowerBi en España
¡Aprende a usarlo siempre estés donde estés!
Formación totalmente práctica 100% con profesores
Target audiences
Profesionales de las tecnologías de información, gestores de TI, Analistas de Negocio, Analistas de sistemas, arquitectos Java, desarrolladores de sistemas, administradores de bases de datos, desarrolladores y profesionales con relación a el área de tecnología, marketing, negocio y financiera.
Videotutoriales y Manuales publicados por Stratebi
- ALM Toolkit para PowerBI
- Tabular Editor con PowerBI
- PowerBI Embeded – Buenas Prácticas
- PowerBI Tips (vol I)
- PowerBI Tips (vol II)
- Buenas prácticas con Dataflows en PowerBI
- Integracion SAP - PowerBI
- Futbol Analytics, lo que hay que saber
- Dashboard de medicion de la calidad del aire en Madrid
- Como funciona Microsoft Power BI? Videoturial de Introducción
- Big Data para PowerBI
- Como integrar Salesforce y PowerBI
- Videotutorial: Usando R para Machine Learning con PowerBI
- Las 50 claves para aprender y conocer PowerBI
- PowerBI: Arquitectura End to End
- Usando Python con PowerBI
- PowerBI + Open Source = Sports Analytics
- Comparativa de herramientas Business Intelligence
- Use Case Big Data “Dashboards with Hadoop and Power BI”
- Todas las presentaciones del Workshop ‘El Business Intelligence del Futuro’
- Descarga Paper gratuito: Zero to beautiful (Data visualization)
- Aprender DAX Studio para Power BI
- Power BI Report Builder
Syllabus
Curso de PowerBi Avanzado
- Online
Fecha: Del 12 de abr. al 13 de abr. de 2023
Horario: 15:00 h - 21:00 h ( CEST - Madrid)
Lugar: Plataforma web con profesor
Precio: 95 € (iva no incluido) / persona
Pago: PayPal o Trans. Bancaria (Consultar)
Certificado: Entrega a todos los asistentes
- Contextos de evaluación en DAX
- Medidas y columnas calculadas
- Creación de tablas
- Operaciones de filtrado
- Operaciones lógicas
- Operaciones matemáticas y estadísticas
- Operaciones de inteligencia de tiempo
- Operaciones con cadenas de texto
- Otras funciones DAX
- Seguridad a nivel de fila (RLS)
- Dax Quiz
- Ejercicios
- Introducción a Dataflows
- Conceptos de Dataflows
- ETL con Dataflows
- Buenas prácticas
- Lenguaje M
- Ejercicios
- Tabular Editor
- Introducción a Tabular Editor
- Grupos calculados
- Perspectivas
- Advanced Scripting
- Ejercicios
- DAX Studio
- ALM Toolkit
- Data Gateways
- Agregaciones
- Modelos duales
- Machine Learning en Power BI
- Python en Power BI
- R en Power BI
- Microsoft Teams con Power BI
- Power BI Report Builder
5. Buenas prácticas Microsoft Power BI
6. Ejercicios (Opcionales)
Dashboards and Scorecards
Dashboards and Scorecards
Goal
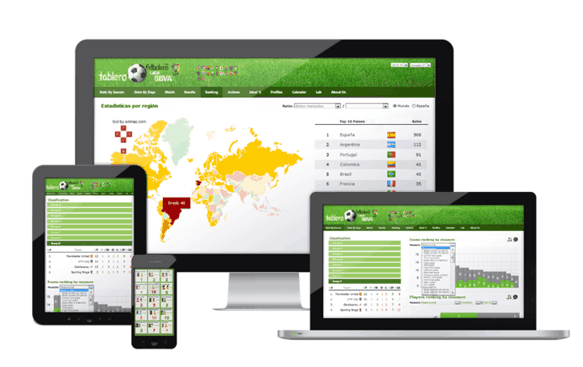
Dashboards are fully open and can integrate all kinds of external components : Google Maps, RSS news, Twitter, Facebook info, external sources, etc.
Dashboards are the great strategic tool for managers and analysts today.
They have become the most powerful to follow the progress of the company and the market competitive weapon , and react quickly and effectively.
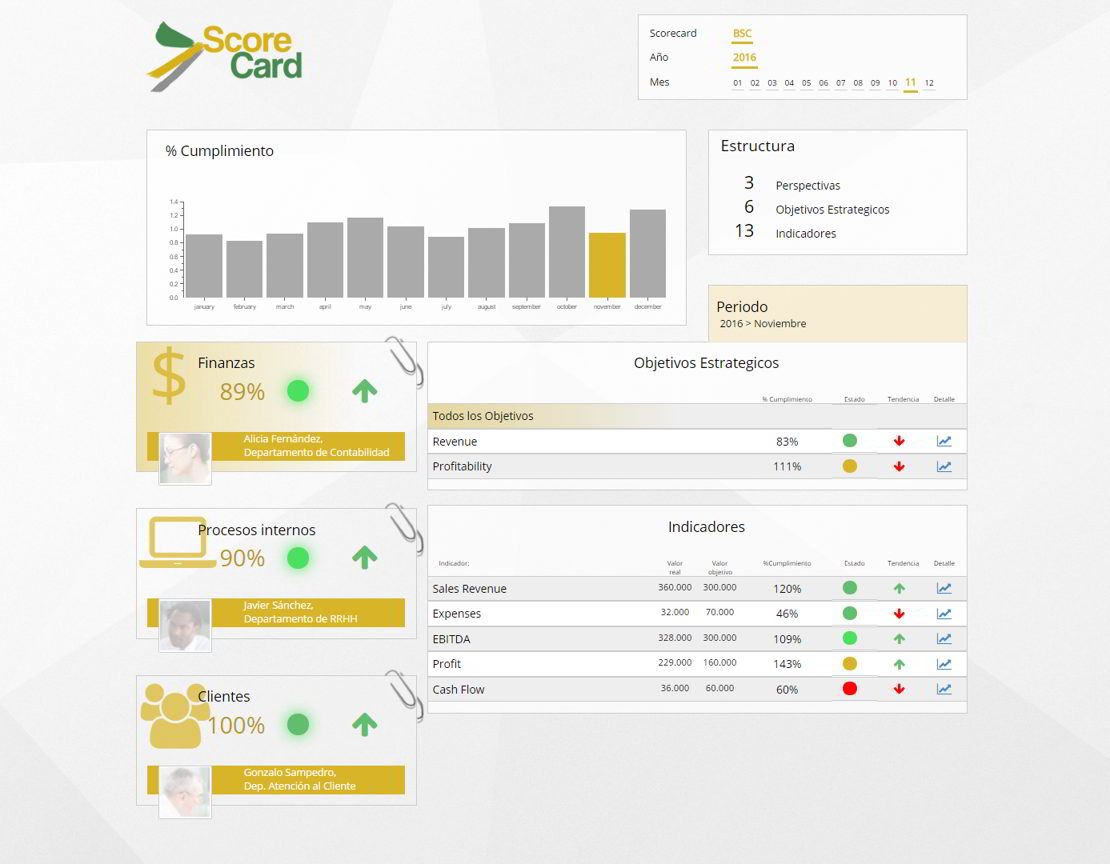
In addition , by identifying the KPI (Key Performance Indicators) keys corporate organization Scorecards are implemented, following the methodology of Norton and Kaplan.
The aim is to teach students to build advanced methods Reporting and Dashboards data mining resources of a system on Pentaho Business Intelligence to analyze data from various sources and systems.
Target audiences
Observations
Os incluimos las principales claves para construir potentes Cuadros de Mando, del Curso de creación de Dashboards Open Source:
<iframe class="col-offset-xs-2" frameborder="0" height="485" marginheight="0" marginwidth="0" scrolling="no" src="//www.slideshare.net/slideshow/embed_code/key/wb7K1ZIwm6iBe" style="border:1px solid #CCC; border-width:1px; margin-bottom:5px; max-width: 100%;" width="595"></iframe><br />
Syllabus
Introduction Open Source Business Intelligence Platforms
- Architecture and features of Pentaho, SpagoBI, BIRT, Mondrian, Kettle, Talend, etc.
- Development Tools.
Introduction to Scorecards
Good practices in Dashboards
ScoreCards and Scorecards
Dashboards custom (Different technologies and examples)
CDF technologies and CDE
installation CDE
Working with CDE
- Understanding Layouts components
- Data Extraction (CDA Technology)
- File structures
- Kettle origin
- Source Definition (JNDI)
- MDX and SQL queries
- Graphic elements
- Parameterisation and dependencies
- Interaction between graphical elements
- advanced elements
- Xactions
- Integration of external graphics libraries
- Applying CSS Styles
- Javascripting
- Export Dashboards
- Dashboards for mobile devices
- Advanced exercises
Related Assets:
Contacto
Ajustamos cada curso a sus necesidades.
Nuestra oficina en Madrid
- Avenida de Brasil 17. Planta 16
- 28046 Madrid
- info@stratebi.com
- Tlfno: +34 91.788.34.10
- Fax:+34 91.788.57.01


