
STPivot Open Source OLAP tool 
STPivot is based in old Jpivot and Pivot4J projects, now not in progress, where we´ve included, improved and strengthened many new functionalities mentioned below as technical features.
STPivot includes an innovative work space for selecting your query that allows end users work easily using drag and drop. End user can identify quickly which dimensions, measures or filters in order to work with them. Now, you can search, filter, rank and select in order to refine your queries as a first approach previous a query, avoiding waiting for long query response times.
Has been improved design, usability, graphs and, in summary, easy to use and manage for end users.
STPivot supports Mondrian 4, so it allows grant scalability, compliance and performance improvements and, working as a Pentaho plugin, working wih last available Pentaho versions.
Main Features an Download
You can download open source code from Github. We´ll be grateful of helping you in your Business Intelligence projects using Open Source tools if you need support, development and consultancy. We´d like to receive your feedback: info@stratebi.com
-
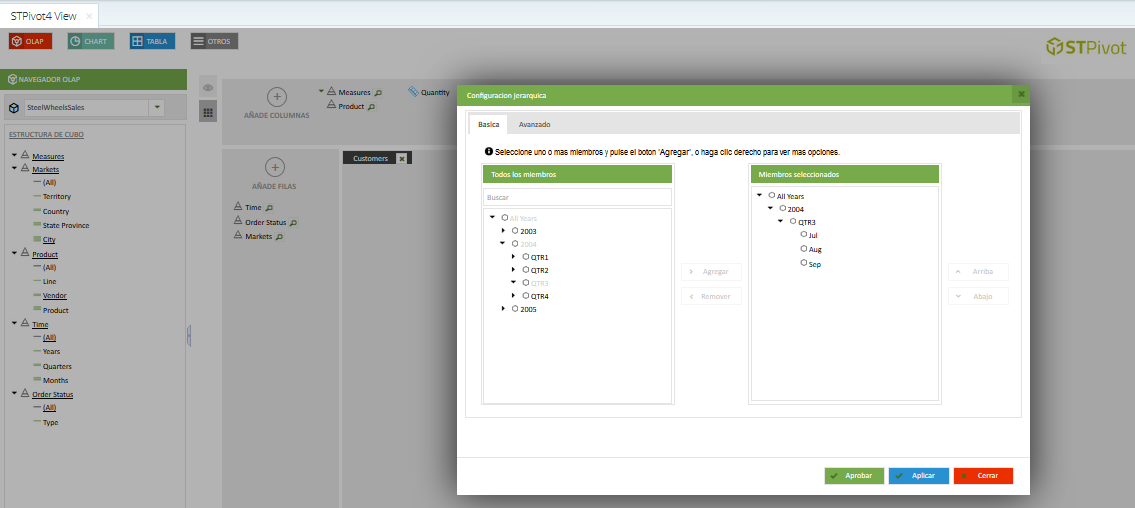
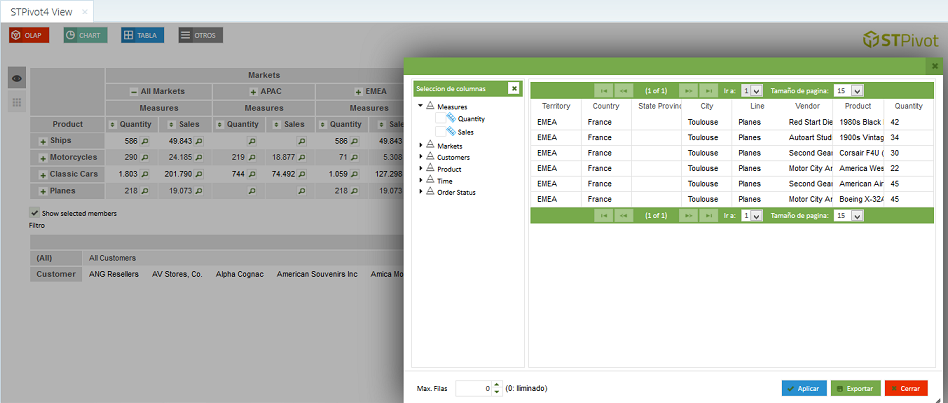
Cube Selector
We've created a new popup window where end users can easily select dimension values, measures, levels... for their queries. It includes a new search feature that improves value selection with high cardinality dimensions.
In your design window, end users can drag and drop their dimensions, filters and measures quickly and easily.
-
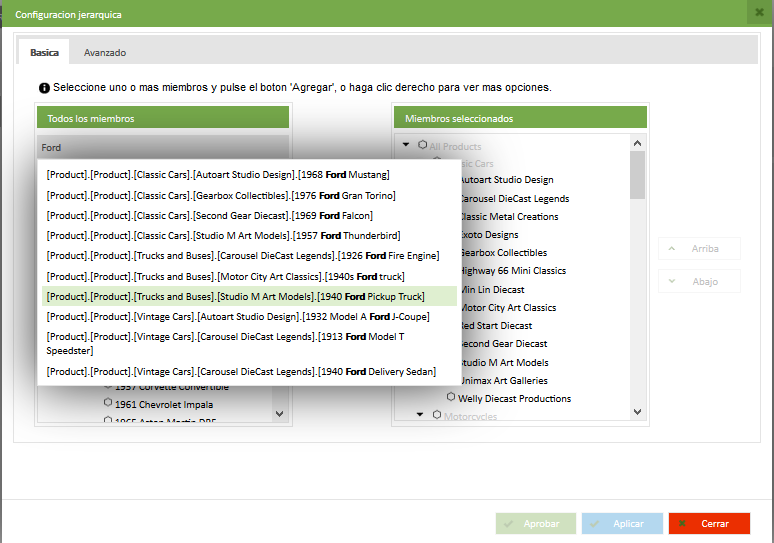
New search functionality
One of the best new features of STPivot is the ability of search dimension values easily, when you manage a great number of values.
This is very helpful when you need to identify your desired values on each level/dimension/hierarchy in order to include them in our query result.
-
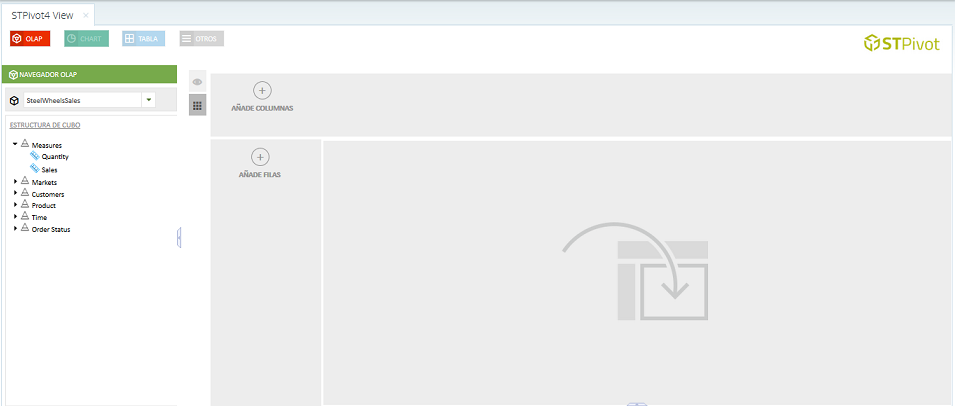
Drag and Drop query design and build
If sometime you wanted to build your queries easily and quickly, with this visuall drag and drop design now it´s possible.
-
Filter and drill to detail
One of the best functionalities of any OLAP Viewer is the possibility of drill through any dimension and measure in order to get powerful insights about yor data models.
-
Advance Filters
It´s included advance filters within the Selector, so you can leverage all the power of OLAP cubes, refining your queries and nesting each filter.
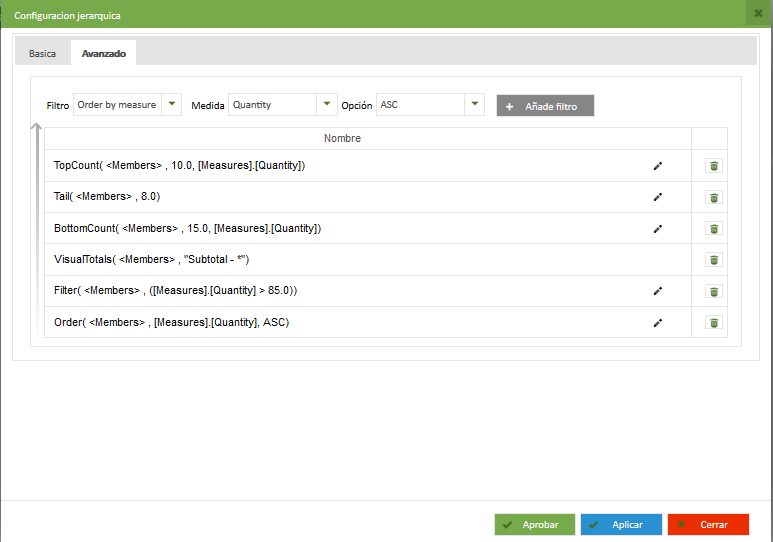
Ranking Top Count
Ranking Bottom Count
Order
Visual Totals
Filter
Limit First/Last
-
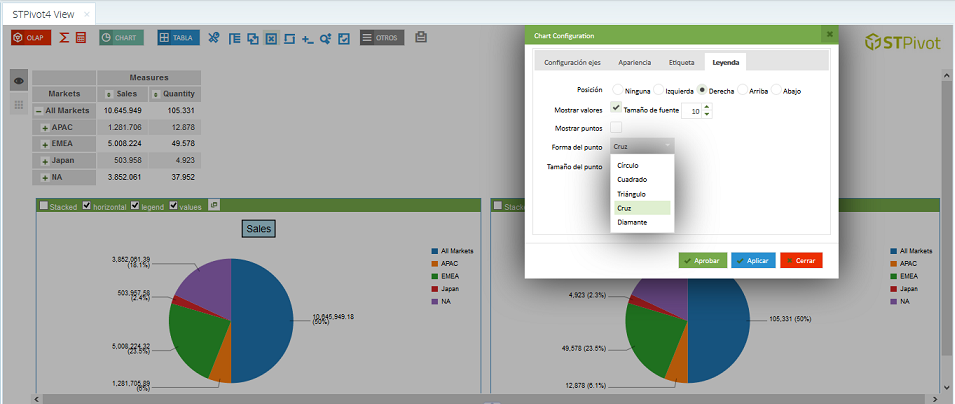
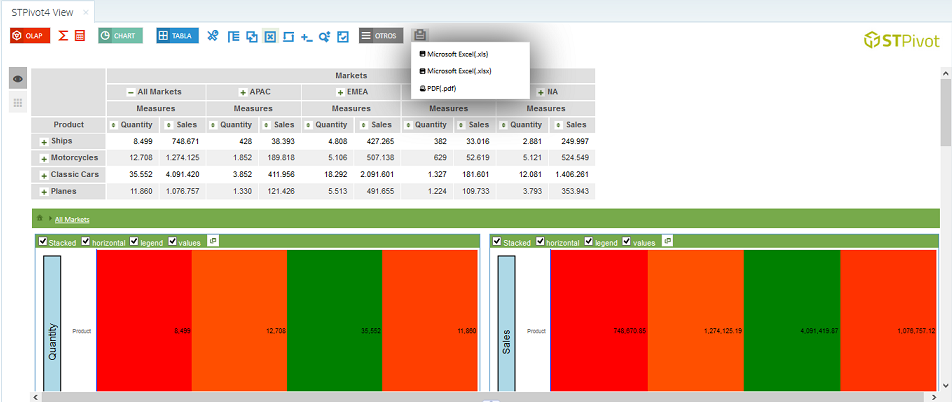
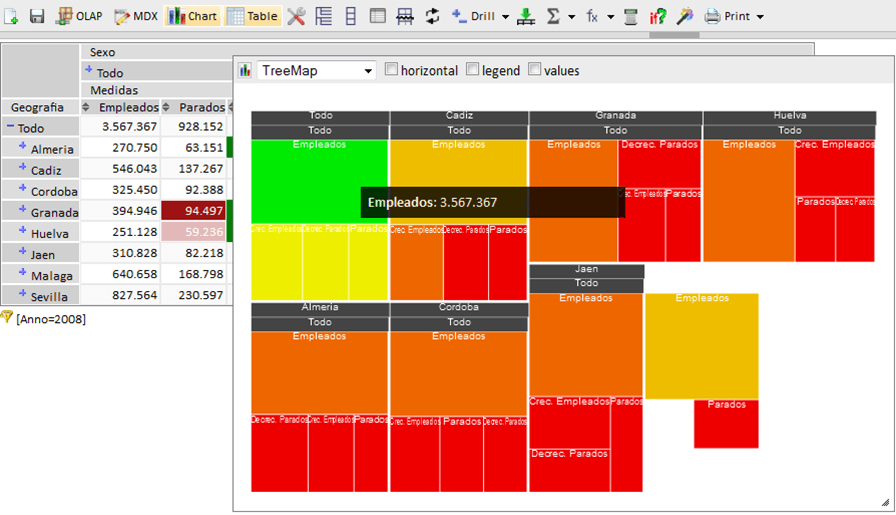
Graphics and Visualization
STPivot includes a great variety of graphic libraries (pie, chart, heatmaps, line, bar...) fully configurable with popup information for any of your analytical needs.
-
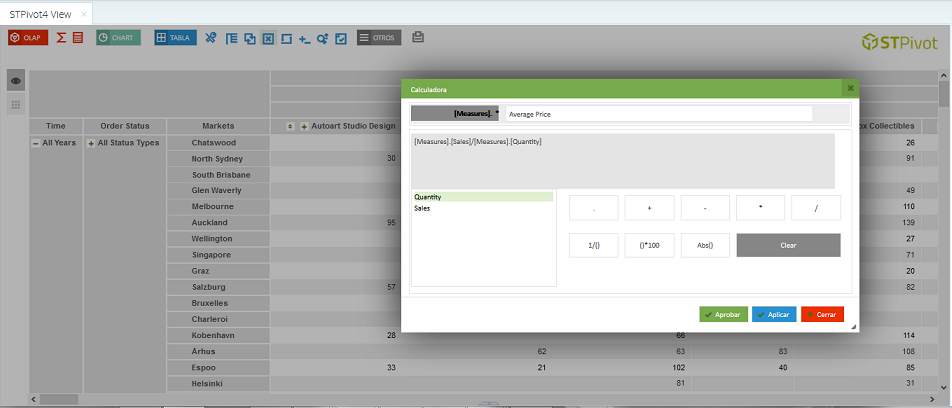
Calculator
All the simplicity and power for end users, so they can directly create their own formulas with a friendly interface, in order to include them in their OLAP views.
Roadmap
We are working on new functionalities for STPivot. Some of them are listed below:
Creación de Formulas complejas
Creación de miembros calculados para uso en consultas
Analysis Wizard
What If
Undo Feature
Mejoras en usabilidad, diseño, resolución de problemas conocidos, etc...
New 'cool' ideas...
Technical Features Pentaho Open Source
All the modules included in Pentaho BI CE by Stratebi, can be used integrated or stand alone, depends on Oragnization needs. Check our Demo Online with all the modules working together
Pentaho Data Integration (PDI)
It transforms and integrates data from existing information systems and Datamarts that make up the BI system.
- Graphical development environment
- Using standard technologies: Java, XML, JavaScript
- Easy to install and configure
- Multi platform
- Based on two types of objects: Transformations (collection of steps in a process ETL) and jobs (collection of transformations)
- It includes 4 tools to manage the ETL processes (SPOON, PAN, CHEF and KITCHEN)
Pentaho Reporting (PRD)
It gets and displays report indicators of your organization. They can be made by an end user or predefined for a direct query. These reports can be viewed in standard formats such as html, pdf or excel.
- It provides critical functionality for end users and web access, parameterized reports, scheduling, subscriptions, or distribution (bursting)
- It provides advantages to experts in reporting such as access to heterogeneous data sources, integration capabilities in applications or portals and modular protocol settings (display and query)
Pentaho Analysis - STPivot
You can view, explore and analyze your organization's information interactively and can select different perspectives of such information based on predefined criteria.
- Dimensional view of data (sales, period, customer, …)
- Browse and explore (Ad Hoc analysis,
drill-down, select a specific member for analysis, ...) - Interacting with high performance, optimized for fast interactive response technology
Pentaho Data Mining
You can discover hidden patterns of behavior and indicators on information from your organization.
- Powerful Data Mining engine graphic tools
- Graphical tools
- Web services, repositories and XML based definitions
- Security, performance and scalability
Sparkl
Sparkl is a powerful tool that provides Pentaho for creating custom plugins. The plugins can have different objectives, such as the implementation of new functions or creating dashboards using the frameworks facitlitados by ctools (CDE , CDF , CDA, ...)
Big Data
Pentaho provides the necessary tools to analyze large volumes of data in order to be able to identify recurring patterns in these data tools. You can apply the full power of analysis, reporting and dashboards data obtained. PDI includes the connectors for the main distributors of analytical databases.
Multidimensional analysis (OLAP) gives advanced users and analysts the full power of cross-checking data at all levels, getting key answers in almost real time.
From weeks to minutes so is the power of multidimensional OLAP solutions we work with. No need to rely on knowledge or technology departments, users can make their own advanced adhoc analysis.
Using OLAP cubes is very common in implementations, such as the case of KUEHNE, EOI, Universidad Autónoma de Madrid...
Everything an analyst needs for a query, analytical reporting and decision making: charts, graphics capability, drill down, drill to detail, export to different formats, securization by roles, ...
The multidimensional analysis provides data access at high speed, thanks to its multidimensional design. One structe oriented to the analysis and decision making.
See some examples of OLAP cubes in operation in our Demos section.
Pentaho Open BI is the world's leading source solution. It has become a great alternative to costly traditional business intelligence systems such as Oracle, Business Objects, Cognos, QlikView or Microstrategy.
The reports are a key element distribution of information in any organization in different formats: predefined, dynamic, adhoc, guided, etc ... We have performed several Reporting projects, such as Italfarmaco, Universidad de Lleida, Amnistía Internacional...
In Stratebi, we know how important distribution of information in an organization is, both internally and externally and we create powerful and robust reporting solutions appropriate to each user profile, according to your needs and levels of securized access to information.
Static reports present information in a predetermined ways (sales by month and area). Dynamic reports allow users to interact with information through "drill down", filters, etc ... to drill down to levels of detail.
In Stratebi, we perform all kinds of reports, from those who have predefined format where the objective is to match the display parameters marked, even those in which users can interact with them, select dates (date picker), filter, ...
These reports can also be planned, so you can schedule your execution and delivery by mail (eg in PDF format) every month of monthly sales to each region manager with a (red, yellow, green traffic light coding) as a visual alert.
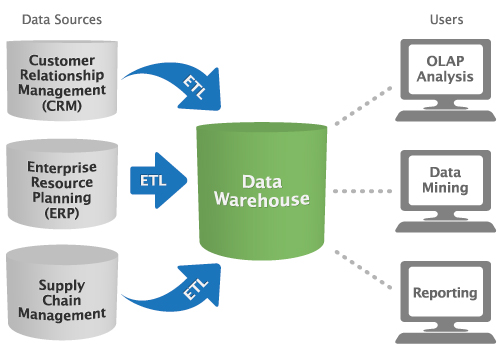
With a Data Warehouse we have a 'life insurance' for the progress of our company.
DataWarehouse objectives:
- Facilitate access to corporate information: The contents of the data warehouse should be understandable, navigable and access it must be characterized by high performance:
- 'Understandable' means properly labeled.
- 'Navigable' means that the desired destination is locatable on the screen and this is at a single "click away".
- 'High performance access' means that the waiting time is zero.
- Give consistency to the information of the organization.
- It is a "life insurance" to protect organizational information: The data warehouse not only controls access to the data effectively, but also provides the "owners" of great information control and powerful media about who uses and abuse of the data.
- It is the foundation for decision-making: The data warehouse has adequate data to carry out the decision-making process. The original name initially used to refer to what we know today as data warehouse systems help decision making (decision support system, DSS), shows clearly what is the purpose of these systems.